

New data on enrollment through the end of the 2019-20 academic year is now available on the statewide public four-year university dashboard, and highlights trends the university system was experiencing ahead of the pandemic and in its early days.
The dashboard is maintained by the Education Research and Data Center, which compiles data about students from the state’s six public-funded universities as they move through school and into the workforce.

The Morning Wire: Keeping you informed on politics, policies, and personalities of Washington State.
As the data does not contain the 2020-21 school year, the full impact of the pandemic isn’t represented, but it still provides a valuable snapshot of higher education in Washington State.
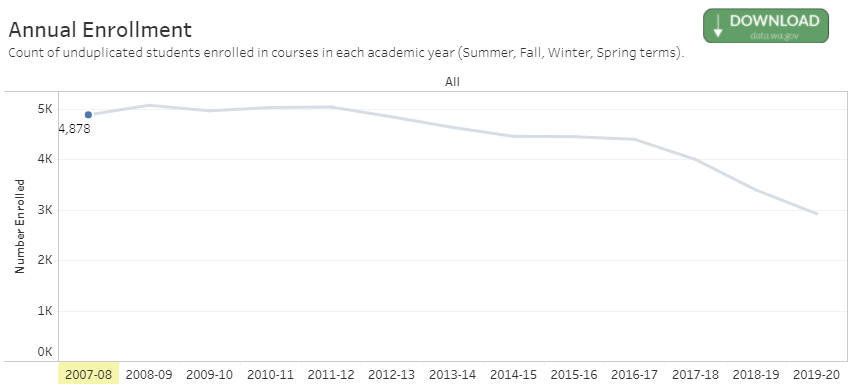
Between the 2018-19 and 2019-20 academic years, statewide enrollment only dropped by about 1,000 students, to 113,411. Of the six colleges, only Central Washington University saw an increase in enrollment, while the University of Washington, Washington State University, Eastern Washington University and Western Washington University all saw slight decreases in enrollment. Evergreen State College saw the most dramatic drop in enrollment, building on a downward trend which it has been experiencing since the 2011-12 academic year, which can be seen below.
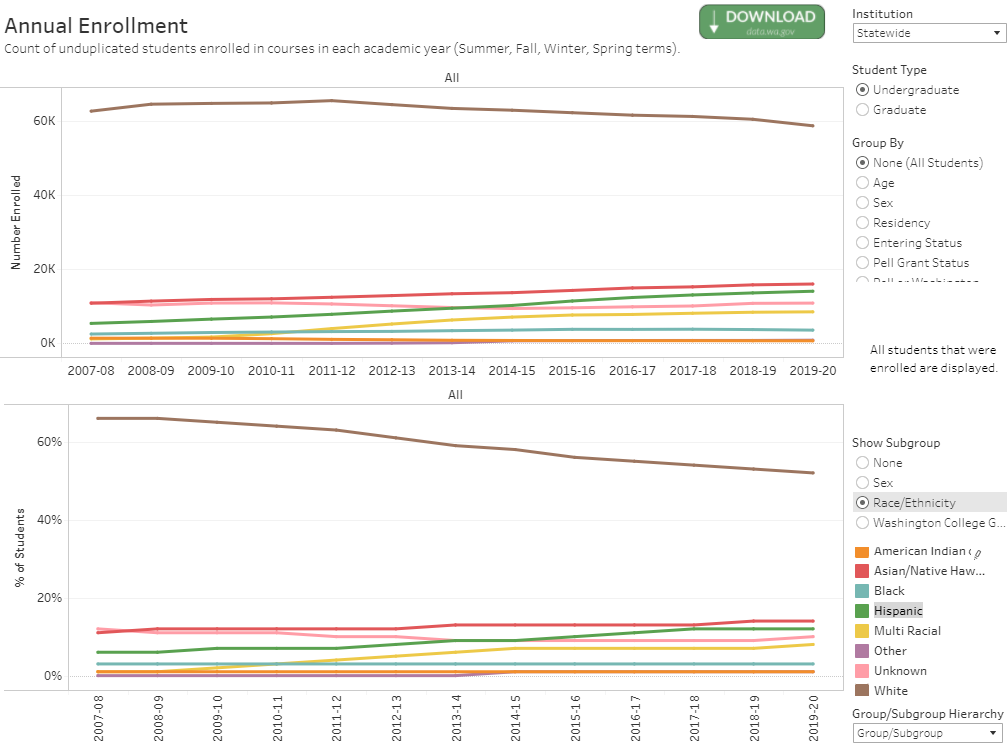
The number of Asian/Native Hawiaan, Hispanic and multi-racial students increased statewide between 2018-19 and 2019-20 school years. At the same time, the number of Black and American Indian students decreased slightly. The number of white students enrolled has been decreasing since the 2011-2012 academic year.
Women have been enrolling in state universities at higher rates than men, and the 2019-20 academic year was no exception. Across the six state public universities, 54% of students were female. In graduate programs, that gap widened, with 56% of enrollees being female.
Perhaps surprisingly, while Evergreen continued to see an overall decrease in enrollment, it saw a boost in graduate degrees awarded, increasing from 110 to 130 in the 2019-20 academic year. Eastern saw the most significant increase, as the number of graduate degrees awarded jumped from 302 to 589 over the same period.
The most common major across the six universities was general business administration and management with 1,197 degrees awarded during the 2019-20 year. It was followed closely by general psychology with 1,110 degrees.
Another figure of interest comes by way of the average time it takes students to complete a bachelor’s degree. The average for all students coming directly from high school was just under four years, while those transferring with an associates degree took 2.58 years to complete their bachelor’s. Those times held relatively true when filtering by race, sex and residency, but when separated by age a major difference can be seen.
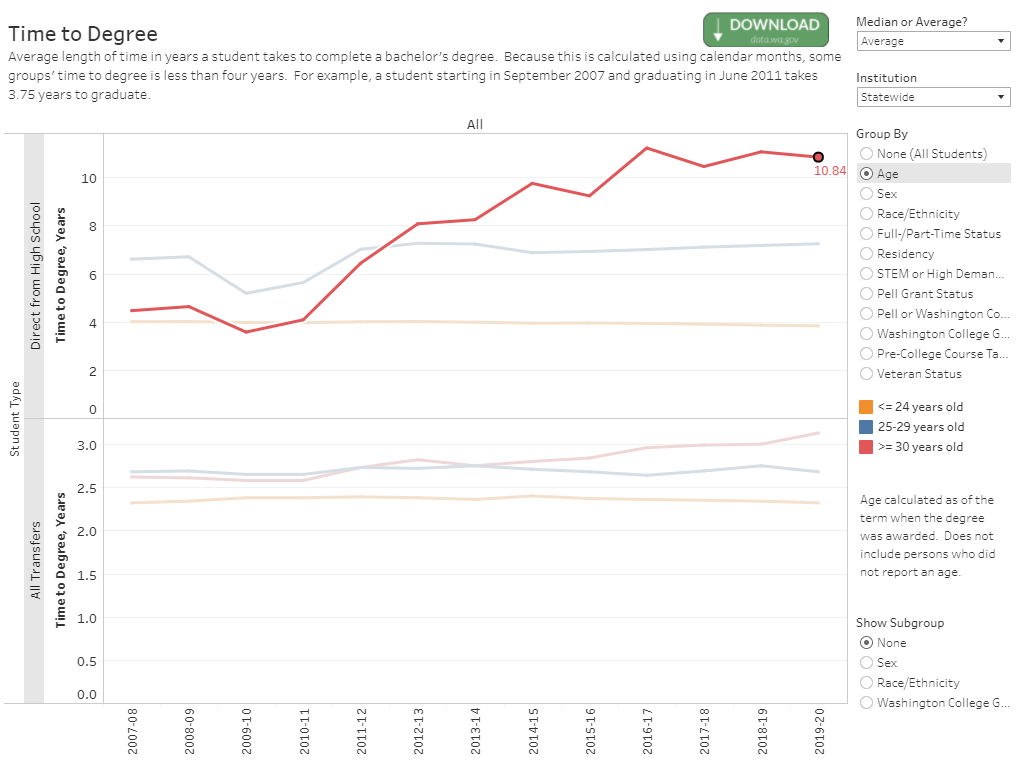
Students ages 30 and older who did not earn an associates degree took an average of nearly 11 years to earn a bachelor’s degree. Students aged 25 to 29 took on average nearly 7.25 years.
Up until the 2010-11 academic years, students older than 30 took roughly the same amount of time as students 24 and younger to earn a degree, but beginning that year, completion time began ballooning.
Universities have already begun releasing enrollment data for the 2021 academic year. For example, Washington State University had 24,278 students enrolled this fall, roughly 1,200 less than last year, and fewer than were enrolled in either 2018 or 2019.
Your support matters.
Public service journalism is important today as ever. If you get something from our coverage, please consider making a donation to support our work. Thanks for reading our stuff.